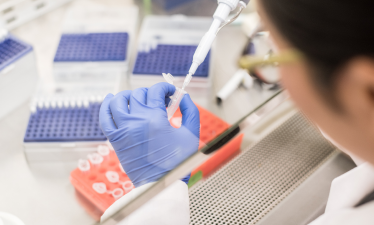
Flow cytometry is an essential lab technique that uses lasers to rapidly evaluate high volumes of cells against multiple parameters. It has broad application in scientific research, clinical analysis, and treatment development. The process results in a huge amount of raw data that must be turned into actionable insights. While this has long been done through a manual gating process that progressively homes in on cell populations of interest, some key challenges are making this classical analysis approach largely unsustainable, as discussed below.
Key Challenges in Flow Cytometry Data Analysis
A big hurdle in using flow cytometry is turning the plentiful data coming from the tests into actionable insights. A few notable challenges stand in the way.
Challenge 1: Flow Cytometry Data Volumes
Flow cytometry data volumes can be massive. To illustrate the breadth of the data, let’s consider the use of flow cytometry in clinical trials where multiple parameters are being assessed in large patient populations. Imagine every top pharmaceutical company is running five to sixteen clinical trials at a time and they are using flow cytometry to analyze patient data. Each trial likely has two to seven assays, and each of those assays is completed for thousands of patients. This results in an incredible amount of raw data. All of that data needs to first be quality controlled. Then the immune cells of interest need to be identified, which can be an incredibly tedious process without the right software tools in place to aid in this work.
Challenge 2: Dimensional Advances in Flow Cytometers
Flow cytometers have historically collected light using detectors for specific individual wavelengths; but the wavelength sensitivity of flow cytometry machines has greatly improved in recent years. Combine this with a growing number of available fluorescent reagents, and output datasets are increasing exponentially. In fact, when automated analysis technology first became available around 1985, cells were being analyzed in five dimensions. By 2020, that increased to about 40 dimensions thanks to advances in individual-wave-length approaches; in the next few years, it is expected to reach beyond 100 dimensions as full spectral flow cytometry becomes more prevalent. As a result, the number of pairwise plots that will need assessment will become too cumbersome to do such manually. As cytometers capture more complete spectral data, manual processes will become unmanageable. As cytometers evolve, flow cytometry analysis software must likewise keep pace.
Limitations of Manual Flow Cytometry Gating and Data Analysis
There are several reasons why manual flow cytometry data analysis and gating is simply not sustainable in a multiparametric, multidimensional environment.
Rudimentary: The 2D dimension of the computer screen is insufficient for the multiple dimensions of the data; analysts have to slice data into a series of 2D projections to walk through results, which is unsustainable for large datasets and limits the ability to see the larger picture.
Variable: The subjectivity of manual human assessment can result in as much as 25% difference between analysts.
Slow: When analysts have to manually draw gates around data points to identify cells of interest or concern, it is incredibly time consuming. In a clinical setting, it may take 30 minutes to 1.5 hours to analyze each sample. There is simply too much data to do this sort of in-house manual analysis at any significant scale. Outsourcing has often been used, but turnaround times can be several months long, which can have a huge impact when assessing patients with progressive disease or when measuring treatment response.
Costly: The salary for multiple analysts is significant at a large scale. Software to aid the process offers significant cost and time savings.
Flow Cytometry Analysis Software
Various types of flow cytometry productivity and analysis software are available. Each serves a unique purpose. We’ll review a few examples.
Raw Instrument Data Acquisition
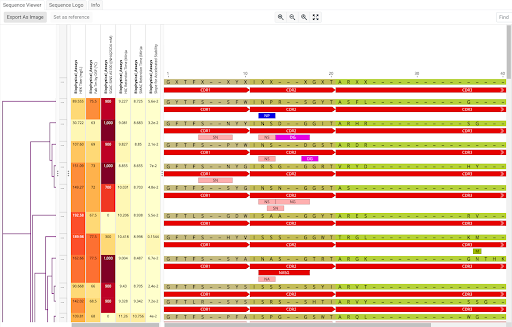
Even before data-analysis bottlenecks arise, simply collecting raw flow cytometry data can be an issue. For example, when different flow cytometers are used within an organization, their outputs are typically encrypted, in vendor-specific formats, or non-file based; as a result, lab IT gets stuck managing various scripts for parsing out metadata and results, aligning data outputs from different machines, and creating models to make data useable. Teams can streamline this cumbersome data-acquisition process by turning to Dotmatics Luma Lab Connect, which can automatically ingest files from any file-based flow cytometer into the Dotmatics cloud. The Luma Lab Connect engine automatically parses files to extract embedded metadata and wrangle scientific data—all with little to no configuration required. Agents are remotely managed, monitored by Dotmatics for stability, and require no configuration beyond instructions on which directories to watch for new data. The data is then automatically made available for more in-depth analysis of flow cytometry results.
Gating Software
As discussed, gates are at the heart of flow cytometry analysis. However, manual gating is a time-consuming and subjective process that can become a major bottleneck in high-throughput, high-dimensional environments. FCS Express and OMIQ can help streamline this sequential gating process and provide tools for customizing and managing gates, creating gating hierarchies (e.g., with boolean “and-or-not” logic), visualizing results, integrating statistical and speciality analyses, and updating corresponding visual and tabular data. Optimizing, or even automating, the gating and analysis process can save an incredible amount of time and money. Key flow cytometry solutions from Dotmatics include:
FCS Express by Dotmatics - Leverage a powerful collection of integrated, ultrafast desktop computation tools to turn raw flow cytometry data into easily-understandable, beautifully-formatted, presentation-ready results more easily and in less time than any other flow cytometry software solution.
OMIQ by Dotmatics - Modernize your flow cytometry analysis by bridging cloud-based machine learning and analytical workflow pipelines with classical gating and analysis.
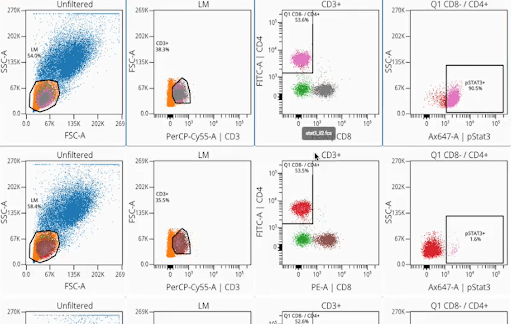
Figure 16: Dotmatics provides a wealth of solutions that can help streamline or automate the gating process for more efficient cell population identification. to more efficiently identify cell populations of interest that warrant further scrutiny.
Clustering and Autogating Tools
With both reagent availability and machine-wavelength sensitivity increasing, high-dimensional flow cytometry is becoming the new normal. Analysts now face the challenge of examining millions of cells against multiple parameters. As a result, traditional approaches for manual gating may no longer suffice. Autogating and clustering tools can help.
Autogating aims to create and automate flow-cytometry-analysis pipelines that mirror manual processes. Autogating pipelines are collaboratively customized to robustly reproduce existing gating hierarchies. Once a pipeline is designed, gates will adjust themselves for each sample using a robust, reproducible framework. Autogating pipelines for automated analysis of flow cytometry data provide data-driven results that are rapid, robust and reproducible.
On the other hand, clustering tools use a variety of high-dimensional and machine-learning approaches (for example high-dimensionality feature identification or dimensionality reduction) to algorithms identify clusters of data, in this case cells, that display similar behavior. Clustering algorithms can help analyze multiple parameters within large cell populations simultaneously. They can beIt important tools for cell population identification because they can characterize and categorize diverse cell populations, whether they are derived from a single sample or from multiple/combined samples.
Broadly speaking there are two types of clustering models: unsupervised and supervised. Unsupervised models don’t use any supplemental biological or clinical variables to help train the model; supervised models do use such additional variables.[31] A key challenge in assessing the performance these algorithms is that the standard of comparison is manual analysis, which is inherently subjective; there is no objective measure of truth to define what should be considered a cluster of cells. Most algorithms for unsupervised automated cell-population identification score around 75% in terms of performance sensitivity and specificity (e.g., looking at factors such as false negatives and false positives).[13] Comparatively, supervised approaches algorithms, such as the automated gating solutions tools by Dotmatics, can often attain close to one-hundred percent accuracy compared to manual analysis.
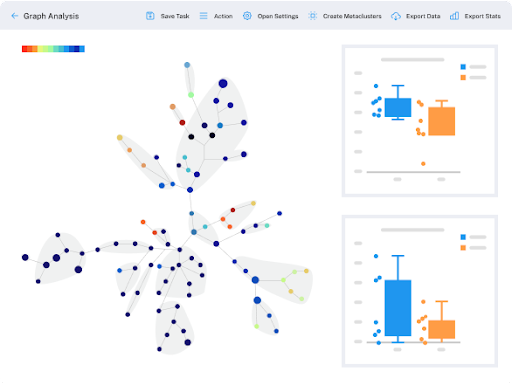
Figure 26: OMIQ by Dotmatics provides clustering tools that can automatically characterize and categorize flow cytometry data points to help assess biological similarity amongst cell samples using multiple parameters.
Dimensionality Reduction Tools for High-Dimensional Analysis
Bringing order to complex high-dimensional data is no small task. OMIQ by Dotmatics provides a wealth of dimensionality-reduction tools that leverage machine learning and GPU-acceleration to rapidly simplify complex data and provide easy-to-interpret visualizations, as shown in Figure 37. In addition, OMIQ offers a number of other tools to support high-dimensional analysis, including solutions for statistical differential analysis, trajectory interference, automated data cleaning, and data normalization.
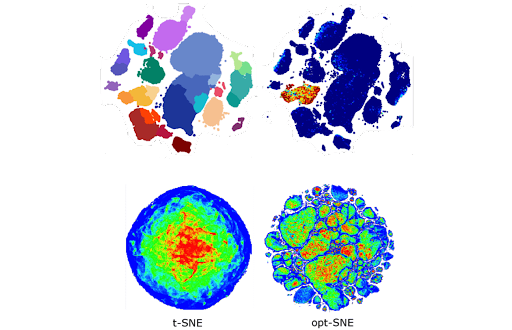
Figure 37: OMIQ by Dotmatics includes dimensionality reduction tools that can help make complex multidimensional flow cytometry data easier to visualize and interpret.
Dotmatics Flow Cytometry Data Analysis Solutions
Dotmatics reduces the onus for manual analysis by delivering powerful flow cytometry data analysis tools on one platform, helping you save time and better understand your flow cytometry data.
Connect with flow cytometers to directly pull raw instrument data and metadata, as well as monitor instrument performance, using Dotmatics Luma Lab Connect.
Identify cells areas of interest with gating and automated gating solutions.
Scrutinize cell subpopulations of interest using speciality analysis, statistics, graphing, and reporting programs.
Leverage machine learning and analytical pipelines to take your analyses to the next level.
Learn more about Dotmatics Luma.
References
Weber and Robinson, Cytometry Part A, 2016 Dec 19; 89(12). doi: 10.1002/cyto.a.2303


