














Data Management & Visualization

Ingest. Structure. Visualize.

Luma delivers enterprise scientific data management software for modern R&D. By automating instrument data integration, Luma brings data from every instrument, system, and file format into one structured, visual layer, enabling faster trending, querying, and decision-making using what's already on the bench.

Two scientists in lab coats reviewing results together on a desktop monitor.

From instrument to insight

Four reasons your data works harder in Luma

What customers gain once their instruments and systems are connected.

  • Ingest from 100+ instruments

    Luma uses powerful parsers to pull in files from any instrument or system, regardless of vendor or software. The metadata and results within are automatically extracted.

  • One harmonized, FAIR data layer

    Data is structured and modeled into a single consistent format, ready for trending, analytics, and for use with AI. No manual data wrangling required.

  • Dashboards you build yourself

    Drag-and-drop charts and dashboards let scientists visualize and query results in a code-free environment.

  • Works with tools you already trust

    Connect to scientific software like BioGlyph, Geneious, FCS Express, and OMIQ, among many others, or extract data via open APIs and JDBC.

Connect what you already have

Works with the tools already in your lab

Luma connects directly to the scientific software your team already uses, so results flow in and out without extra manual steps.

The mechanics of Luma

Data management & visualization, in depth

Every instrument, ingested automatically

Luma watches for new files from any instrument or file-based source, whether they live on Windows, Linux, S3, or behind an API, and parses them the moment they land, extracting metadata and results with no manual configuration.
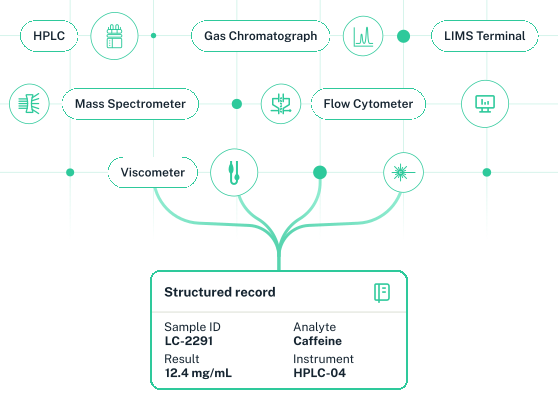
Instruments such as an HPLC, gas chromatograph, mass spectrometer and flow cytometer feeding into one structured record.

Structured once, usable everywhere

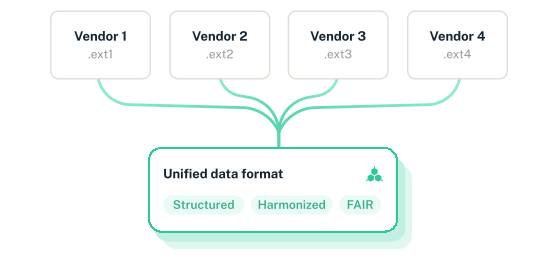
Parsed data is modeled and harmonized into a single, consistent structure, building a complete, FAIR picture of your data that's ready for downstream analysis, reporting, or for further work with AI.

Four vendor file formats converging into one unified data format that is structured, harmonized and FAIR.

Visualize without writing a query

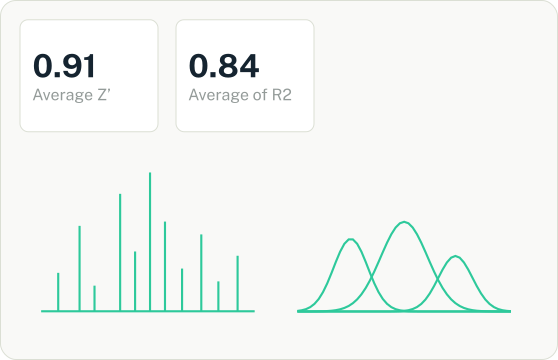
Build custom dashboards and charts with drag-and-drop tools, or simply ask questions in plain language and get results and insights in a code-free environment, extending further with Luma's app-building platform as your use cases evolve.

A dashboard showing summary statistics alongside bar and distribution charts.

Across the entire lab

Built for your whole team

  • Research/Lab Scientist

    Automatically connect data across experiments to compare compounds, campaigns, and research insights.

  • Lab Manager

    Immediate access to cross-experiment views and data trends over time.

  • Informatics Lead

    Consistent documentation capture, ensuring no data quality gaps.

  • R&D Leadership

    Compliance and audit-readiness without the hassle.

  • Executives

    Easy access to overviews of lab results and visualization tools for decision making and stakeholder presentations.

Backed by a team you can trust

With you every step of the way

  • Remote monitoring and management, so your team isn't maintaining infrastructure
  • Data secured in transit and at rest, with governance and permissions controlled through unified catalogs
  • A dedicated Customer Success team supporting onboarding and long-term adoption
  • Training available through documentation, webinars, and live sessions
A scientist wearing safety glasses and blue gloves pipetting a sample in a lab.

Up to 80% faster analysis, without the black box

A global chemicals and materials company had spent decades running manual, macro-based workflows across research teams, leading to delays, inconsistent outputs, and data that was hard to reuse.

After deploying Luma, the company standardized its data processing, replaced black-box scripting with visual, no-code pipelines, and gave scientists flexible, low-code analytics, cutting turnaround time significantly while making results consistent and reusable across teams.

Proof from the field

  • 80%Faster turnaround for application teams
  • 10%Faster turnaround for test teams

Recommended Resources

Next steps

Talk with a Dotmatics representative.

Tell us about your research aims, instrument fleet, and data pain points, and we'll show you what Luma looks like for your lab.

See how Luma fits into the rest of the Dotmatics platform.

Request a conversation

By submitting, you agree to our Privacy Policy. No spam, ever.